


The taxe foncière is the main annual local property tax paid by owners of houses, apartments and other taxable property, including commercial premises. The amount depends on the property's notional rental value (which the tax authorities set from its location, size, condition and amenities) and the tax rates voted by the local commune and intercommunal authority.
The graphic below shows the average amount per square metre payable by residential property owners in 2025 by intercommunality (EPCI). It ranges from about €1 to €17 per m².
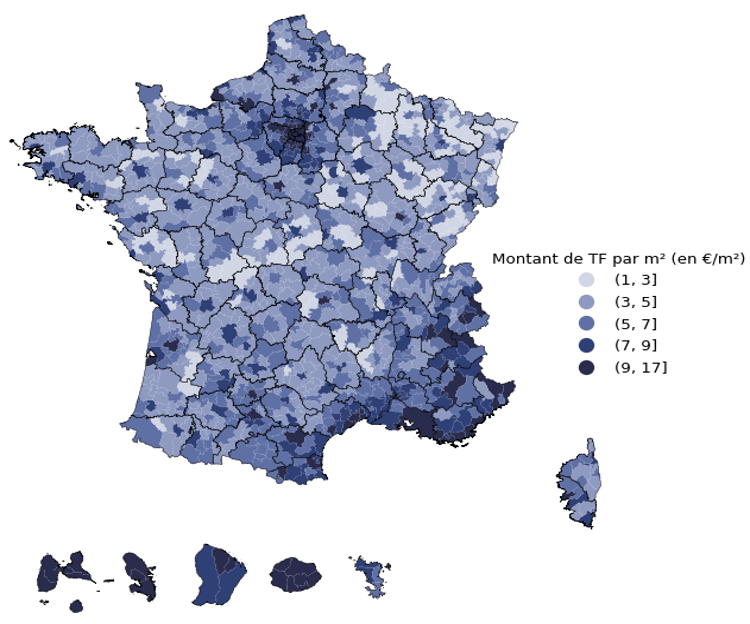
The table below shows the average tax bill in each mainland department in 2025. These figures include companies and owners of several properties, so they are higher than the average homeowner pays. The tax office does not publish a departmental breakdown by type of owner, but it says individual residential owners paid an average of €1,117 in 2025. Housing accounts for 95.5% of taxed premises and about three-quarters of the tax, so the table gives a broad guide to differences between departments.
The figures include the household waste collection tax (taxe d'enlèvement des ordures ménagères, or TEOM). Some councils charge the tax separately (REOM) so in those cases it is not included. There are no separate figures from the tax office for the waste tax, but the consumer group UFC-Que Choisir put the average at €144 per inhabitant in 2023, up 20% in five years, though bills vary widely by commune.
There are substantial differences across the country. Property owners in Seine-Saint-Denis had one of the highest average bills, at €3,675, while the average was just €1,068 in Creuse. The bills in Seine-Saint-Denis are particularly high due to the large number of commercial properties and multi-property owners in the department. The figures also vary considerably within individual regions.
🟦 Auvergne-Rhône-Alpes
Ain | €1,485 |
Allier | €1,563 |
Ardèche | €1,295 |
Cantal | €1,240 |
Drôme | €1,782 |
Isère | €2,104 |
Haute-Loire | €1,324 |
Loire | €1,768 |
Puy-de-Dôme | €1,715 |
Rhône | €1,846 |
Haute-Savoie | €1,356 |
Savoie | €1,551 |
🟩 Bourgogne-Franche-Comté
Côte-d'Or | €1,763 |
Doubs | €1,431 |
Jura | €1,534 |
Nièvre | €1,374 |
Haute-Saône | €1,224 |
Saône-et-Loire | €1,579 |
Yonne | €1,472 |
Territoire de Belfort | €1,917 |
🟨 Bretagne
Côtes-d'Armor | €1,216 |
Finistère | €1,297 |
Ille-et-Vilaine | €1,502 |
Morbihan | €1,333 |
🟧 Centre-Val de Loire
Cher | €1,423 |
Eure-et-Loir | €1,783 |
Indre | €1,165 |
Indre-et-Loire | €1,604 |
Loir-et-Cher | €1,604 |
Loiret | €1,980 |
🟥 Corse
Corse-du-Sud | €1,493 |
Haute-Corse | €1,108 |
🟪 Grand Est
Ardennes | €1,595 |
Aube | €1,679 |
Marne | €1,876 |
Haute-Marne | €1,376 |
Meurthe-et-Moselle | €1,645 |
Meuse | €1,375 |
Moselle | €1,497 |
Bas-Rhin | €1,545 |
Haut-Rhin | €1,541 |
Vosges | €1,373 |
🟦 Hauts-de-France
Aisne | €1,793 |
Nord | €1,862 |
Oise | €2,067 |
Pas-de-Calais | €1,833 |
Somme | €1,699 |
🟩 Île-de-France
Paris | €2,490 |
Seine-et-Marne | €2,559 |
Yvelines | €2,480 |
Essonne | €2,808 |
Hauts-de-Seine | €2,710 |
Seine-Saint-Denis | €3,675 |
Val-de-Marne | €3,000 |
Val-d'Oise | €2,763 |
🟨 Normandie
Calvados | €1,667 |
Eure | €1,775 |
Manche | €1,535 |
Orne | €1,481 |
Seine-Maritime | €2,326 |
🟧 Nouvelle-Aquitaine
Charente | €1,708 |
Charente-Maritime | €1,491 |
Corrèze | €1,443 |
Creuse | €1,068 |
Dordogne | €1,484 |
Gironde | €1,908 |
Landes | €1,314 |
Lot-et-Garonne | €1,811 |
Pyrénées-Atlantiques | €1,467 |
Deux-Sèvres | €1,424 |
Vienne | €1,469 |
Haute-Vienne | €1,547 |
🟥 Occitanie
Ariège | €1,437 |
Aude | €1,727 |
Aveyron | €1,331 |
Gard | €1,863 |
Haute-Garonne | €2,119 |
Gers | €1,612 |
Hérault | €1,956 |
Lot | €1,538 |
Lozère | €1,246 |
Hautes-Pyrénées | €1,542 |
Pyrénées-Orientales | €1,665 |
Tarn | €1,778 |
Tarn-et-Garonne | €1,978 |
🟪 Pays de la Loire
Loire-Atlantique | €1,649 |
Maine-et-Loire | €1,780 |
Mayenne | €1,306 |
Sarthe | €1,493 |
Vendée | €1,079 |
🟦 Provence-Alpes-Côte d'Azur
Alpes-de-Haute-Provence | €1,785 |
Hautes-Alpes | €1,566 |
Alpes-Maritimes | €1,735 |
Bouches-du-Rhône | €2,279 |
Var | €1,948 |
Vaucluse | €1,925 |
Source: DGFiP, 2025
Related Reading: